

Welcome to idaso


Established in 2014 Idaso specialises in providing traffic, transport and mobility data for use in Strategic Planning, Traffic Impact Assessments, Property Management and Retail Assessments, along with optimisation of existing transport management systems.
Idaso stands for innovative data collection, we pride ourselves in supplying accurate timely data in a fully GDPR compliant manner.
We are delighted to offer our services and software solutions to clients worldwide from Maynooth to Malaysia.
OUR MISSION
We are here to supply timely, accurate and understandable baseline data, empowering our clients prepare representative reports for strategic planning and development purposes.
Founder & Managing Director: Ian Kerr

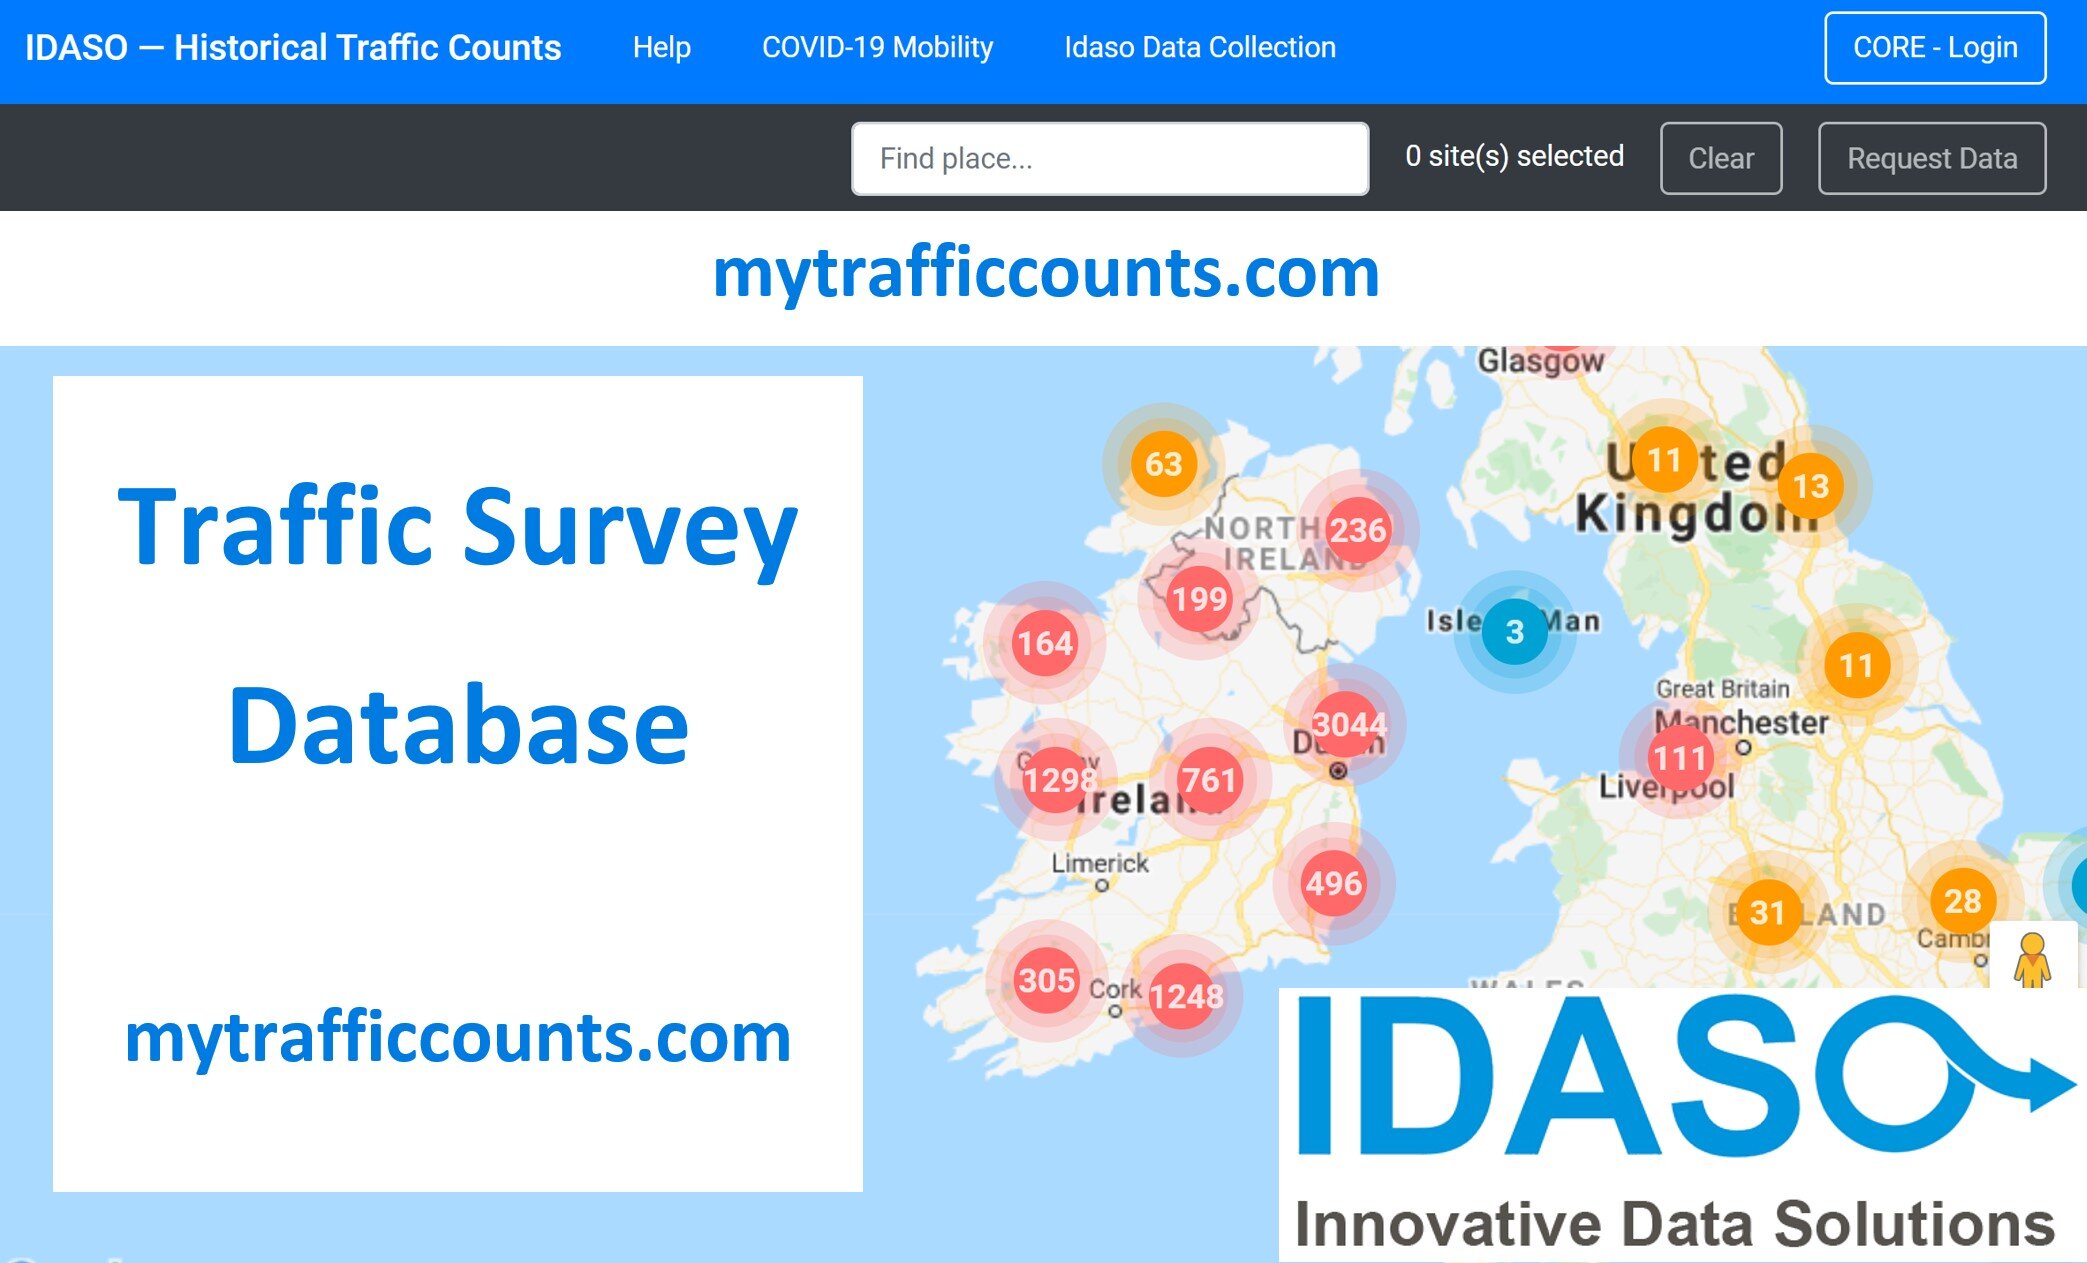
Traffic Count Database

Mobility Data Dashboard

Data Collection Services

Traffic Data Analysis

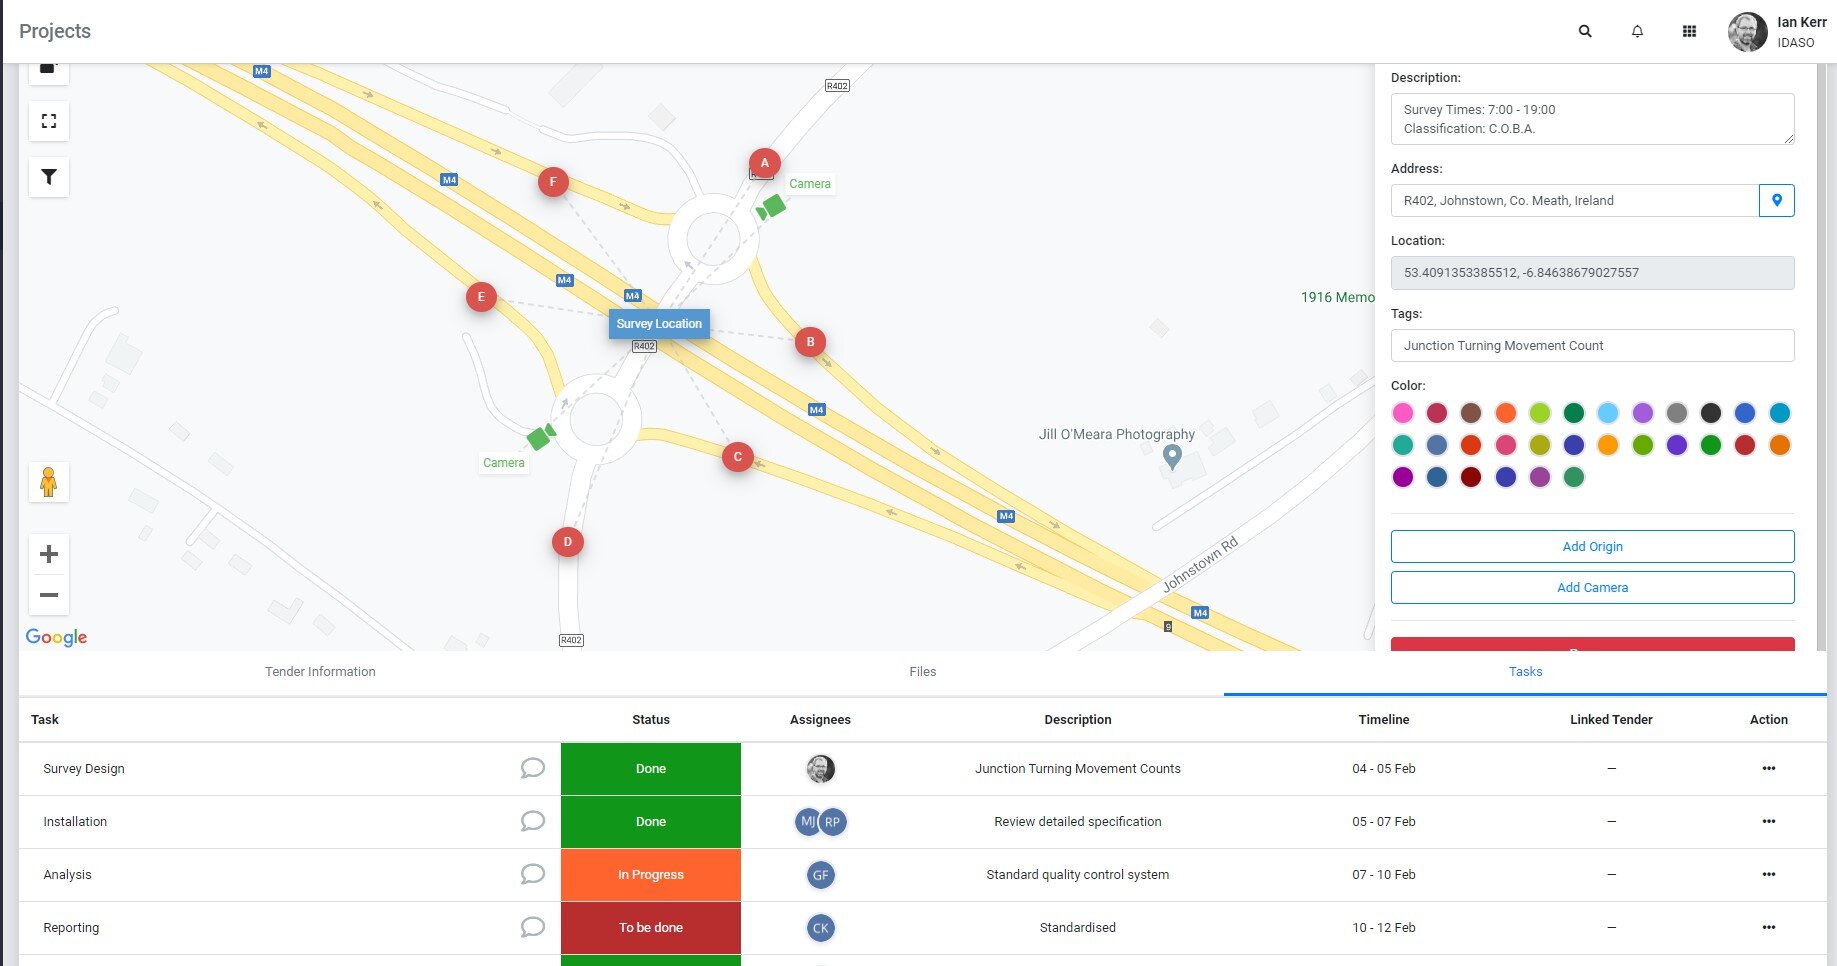
Core Project Management
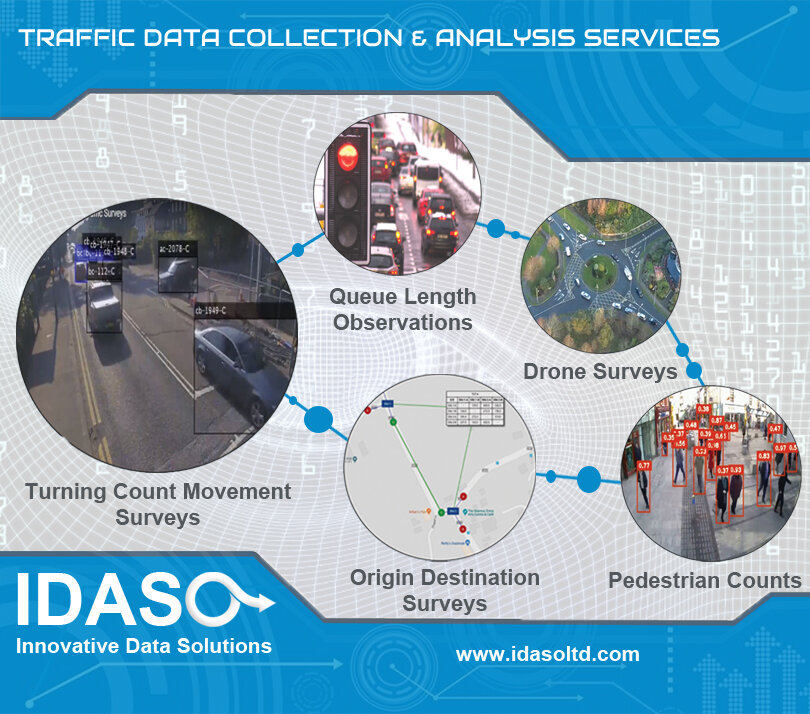
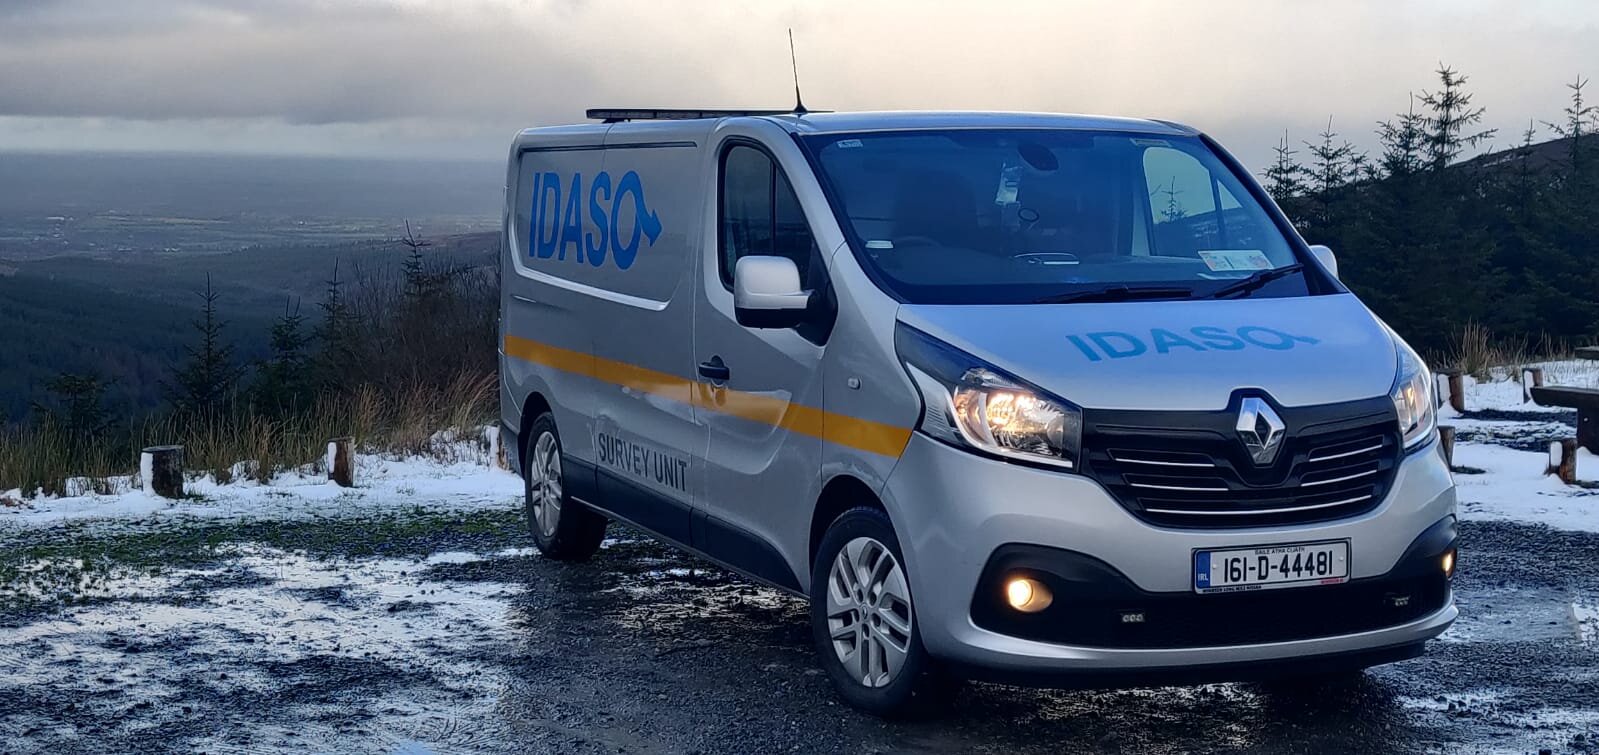
TRAFFIC DATA COLLECTION
IDASO Data Collection provide a range of traffic data collection services from turning counts to origin destination surveys. Through leveraging technologies such as artificial intelligence and cloud based software solutions we have been able to collect data in an efficient manner and present it in user friendly formats in "Analyser" our data visualisation and analysis software
TURNING MOVEMENT COUNTS
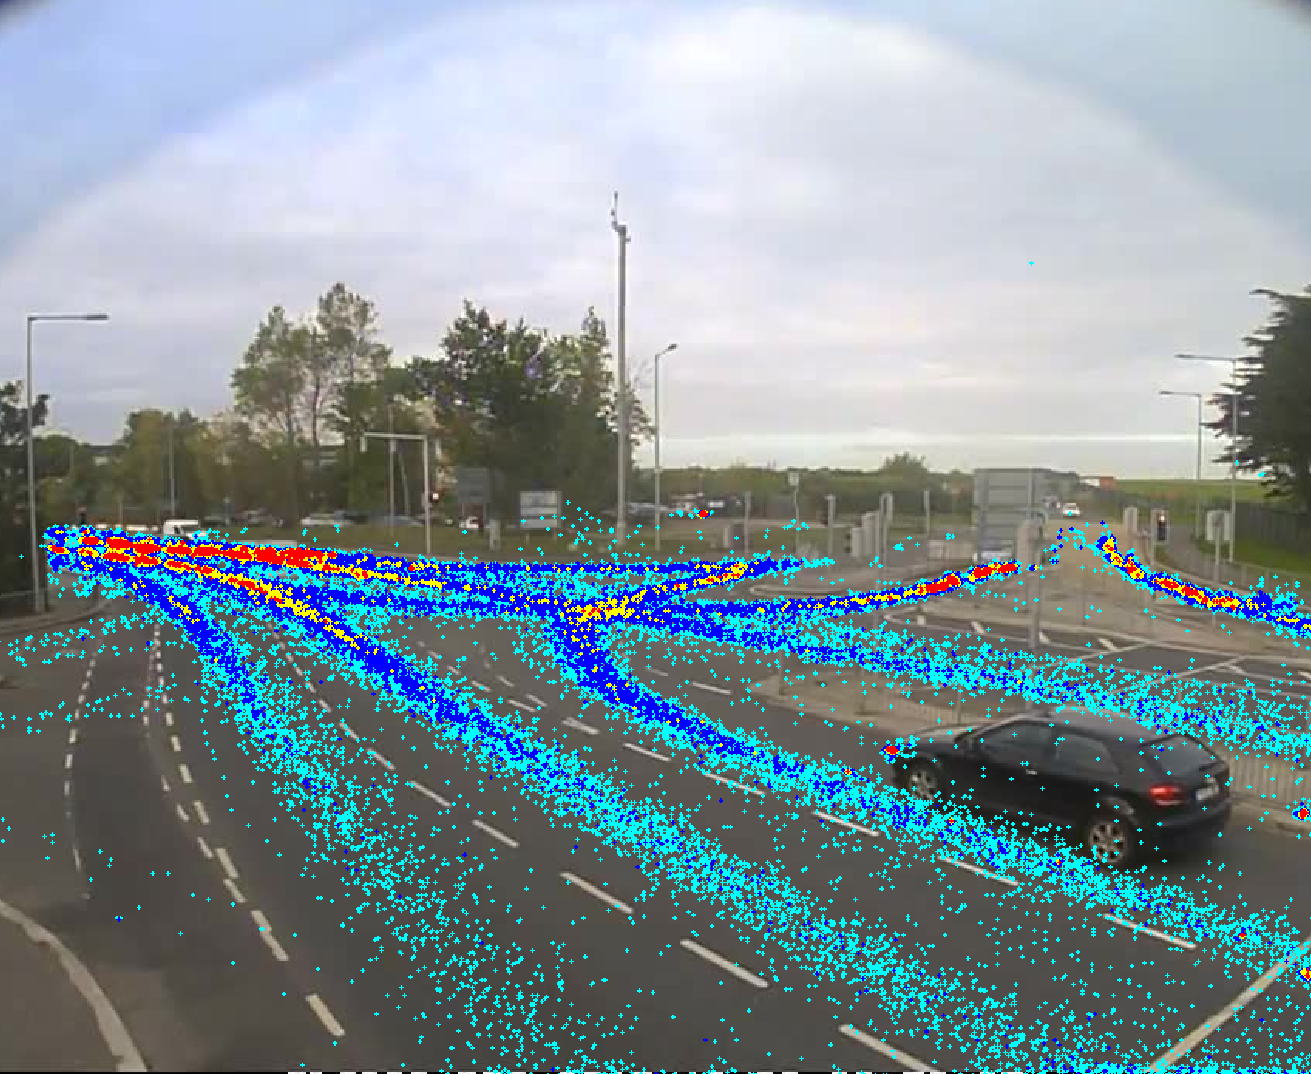
Traffic counts by turning movement and vehicle classification at intersections big and small. Junction counts are gathered through the recording of activity using miniaturised cctv systems and the video files are processed either through our A.I. powered tracking and classification engine "Auto Count", or through our computer aided manual counting software "Smarter Counting". Data is provided in excel based reports in the time interval of client choice. Data can also be viewed in our custom built analysis software "Analyser" to create data visualisations, flow diagrams, automatically identify peak hours among many other features.

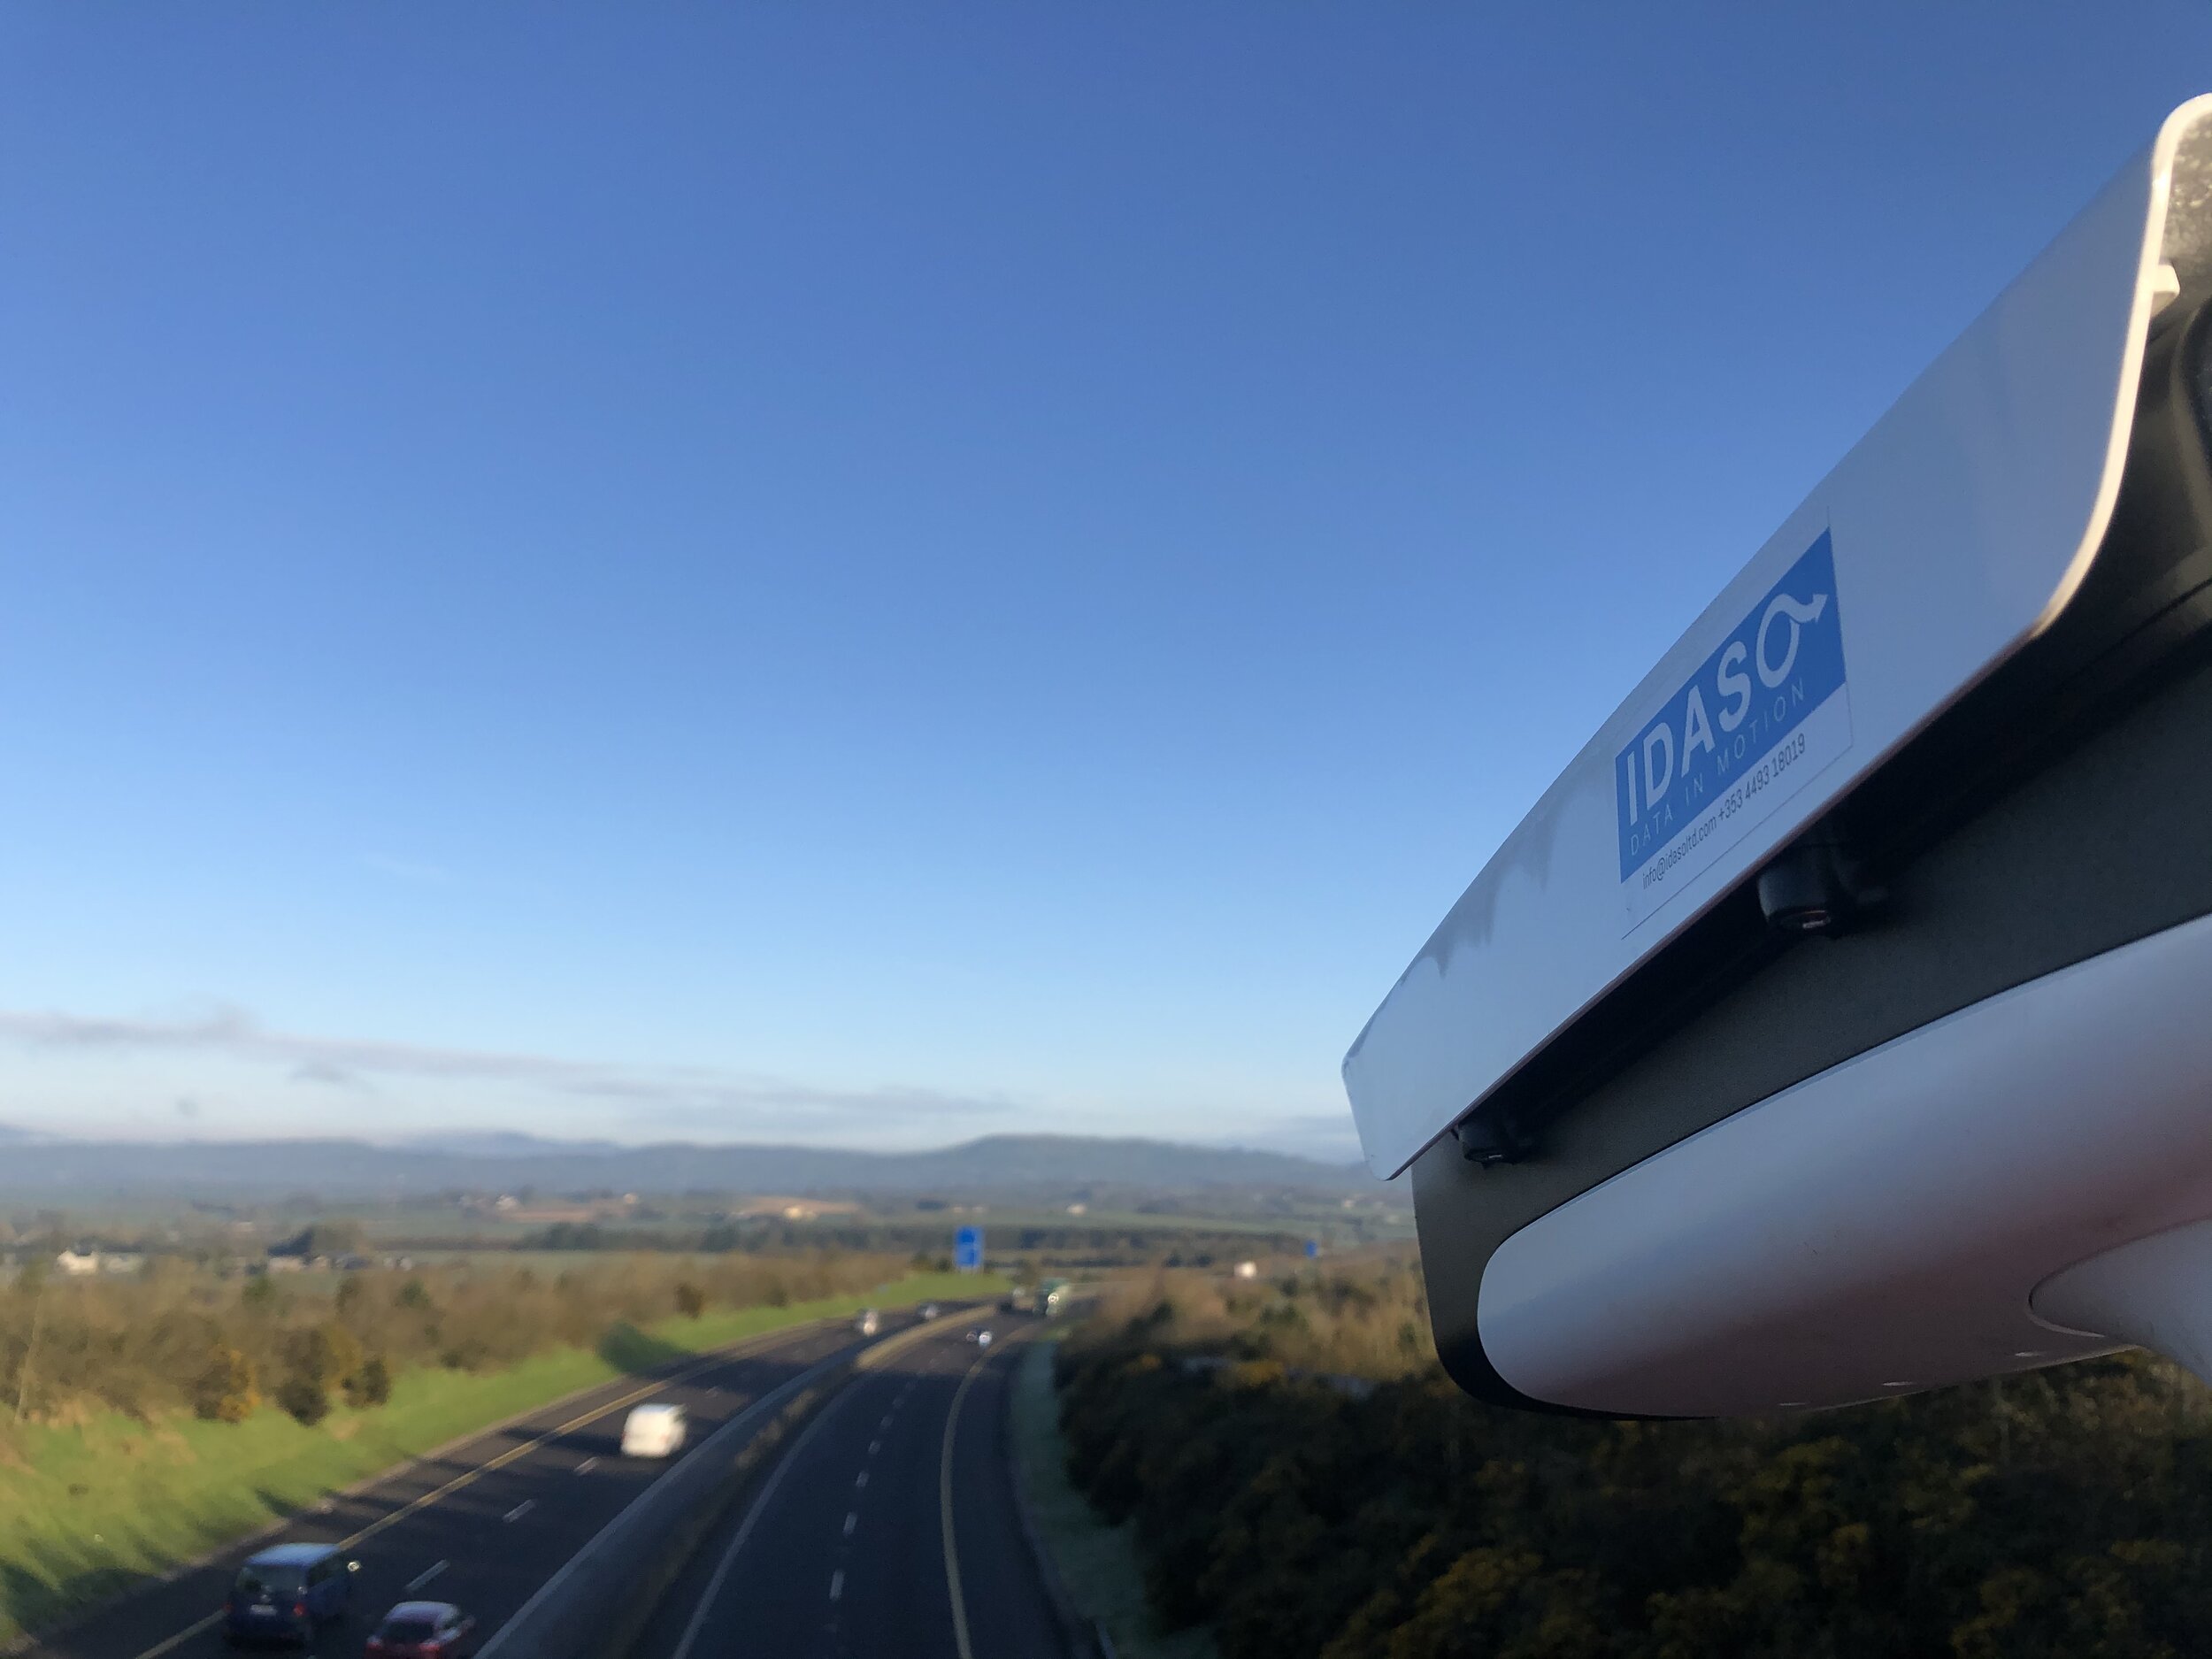
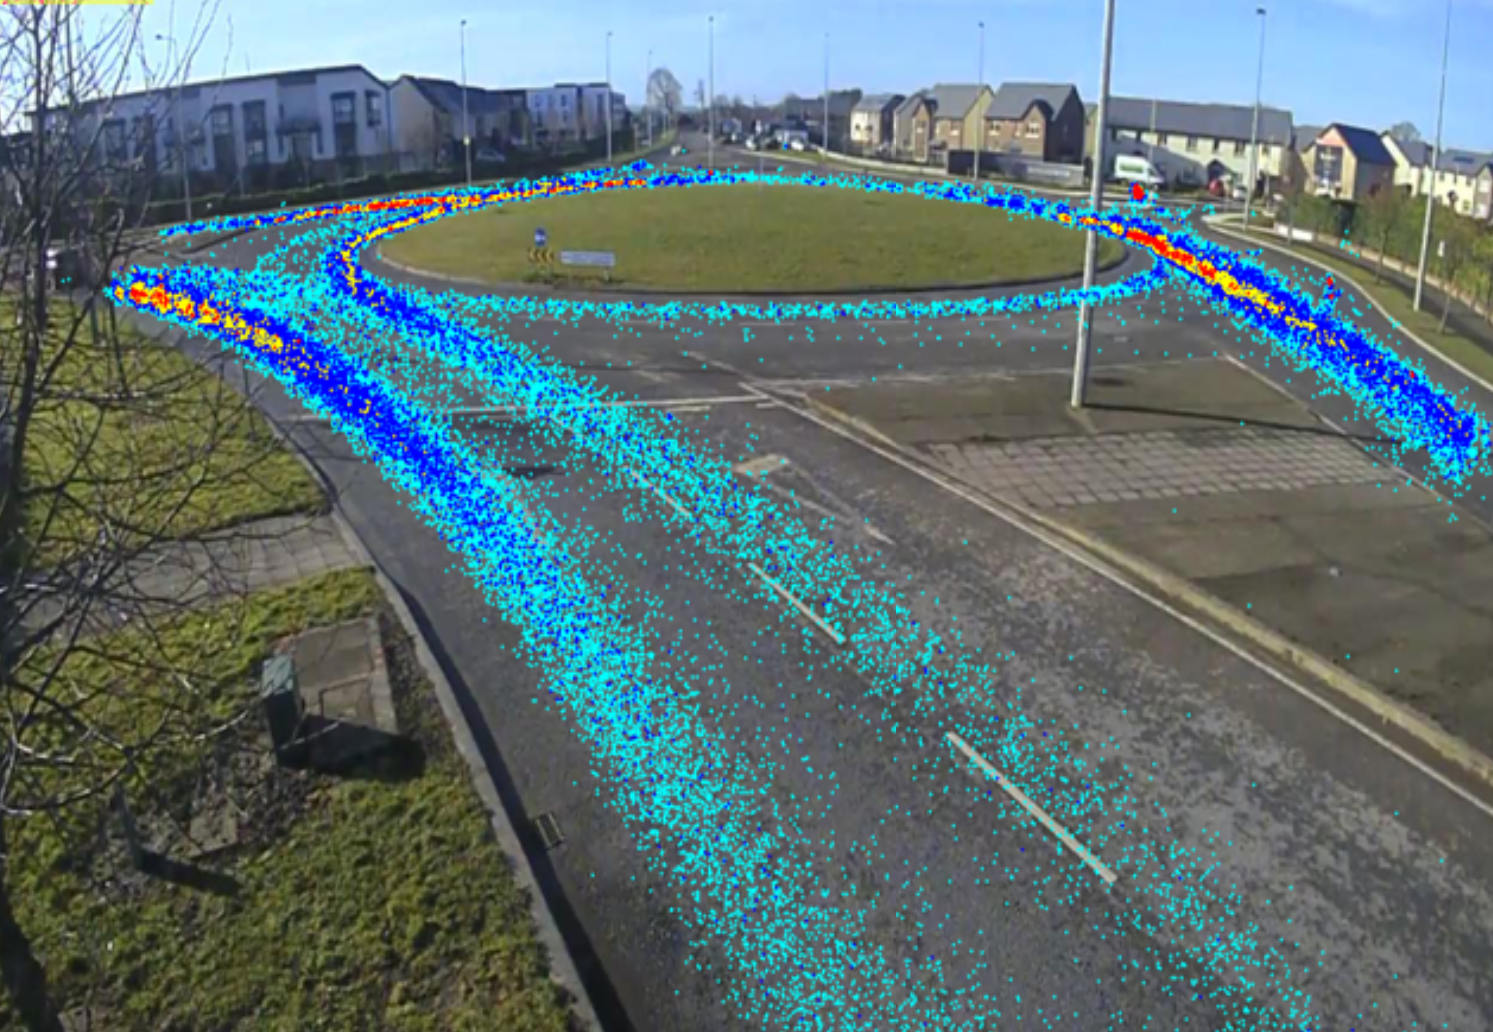
AUTOMATIC TRAFFIC COUNTS / LINK COUNTS
Through the use of industry standard pneumatic tube counters we collected data for extended periods delivering both volumetric, classification and speed statistic data. Not all site are suitable for this methodology and in these circumstances self powering miniturised cctv systems are used to record vehicular activity to be later automatically analysed through our A.I. powered tracking and classification engine "Auto Count" to delivervolumetric and classification data.

PARKING SURVEYS
In car parks, parking beat surveys can record the occupancy of spaces at regular intervals to produce a profile of the use of the car park and ascertain when the car park is most heavily used. The parking beat survey can be used for existing or new developments to justify the level of parking provision. Both off-street and on-street parking trends can be assessed. Parking demand in different areas or zones that are controlled and uncontrolled may also be assessed.

ANPR Surveys
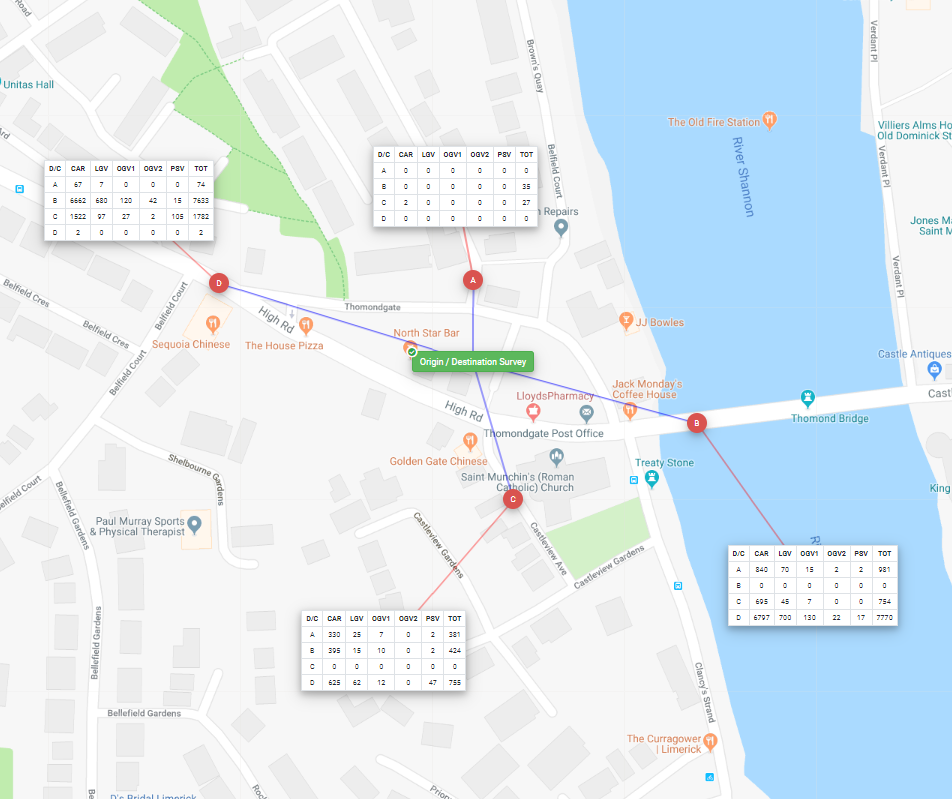
ORIGIN / DESTINATION SURVEYS
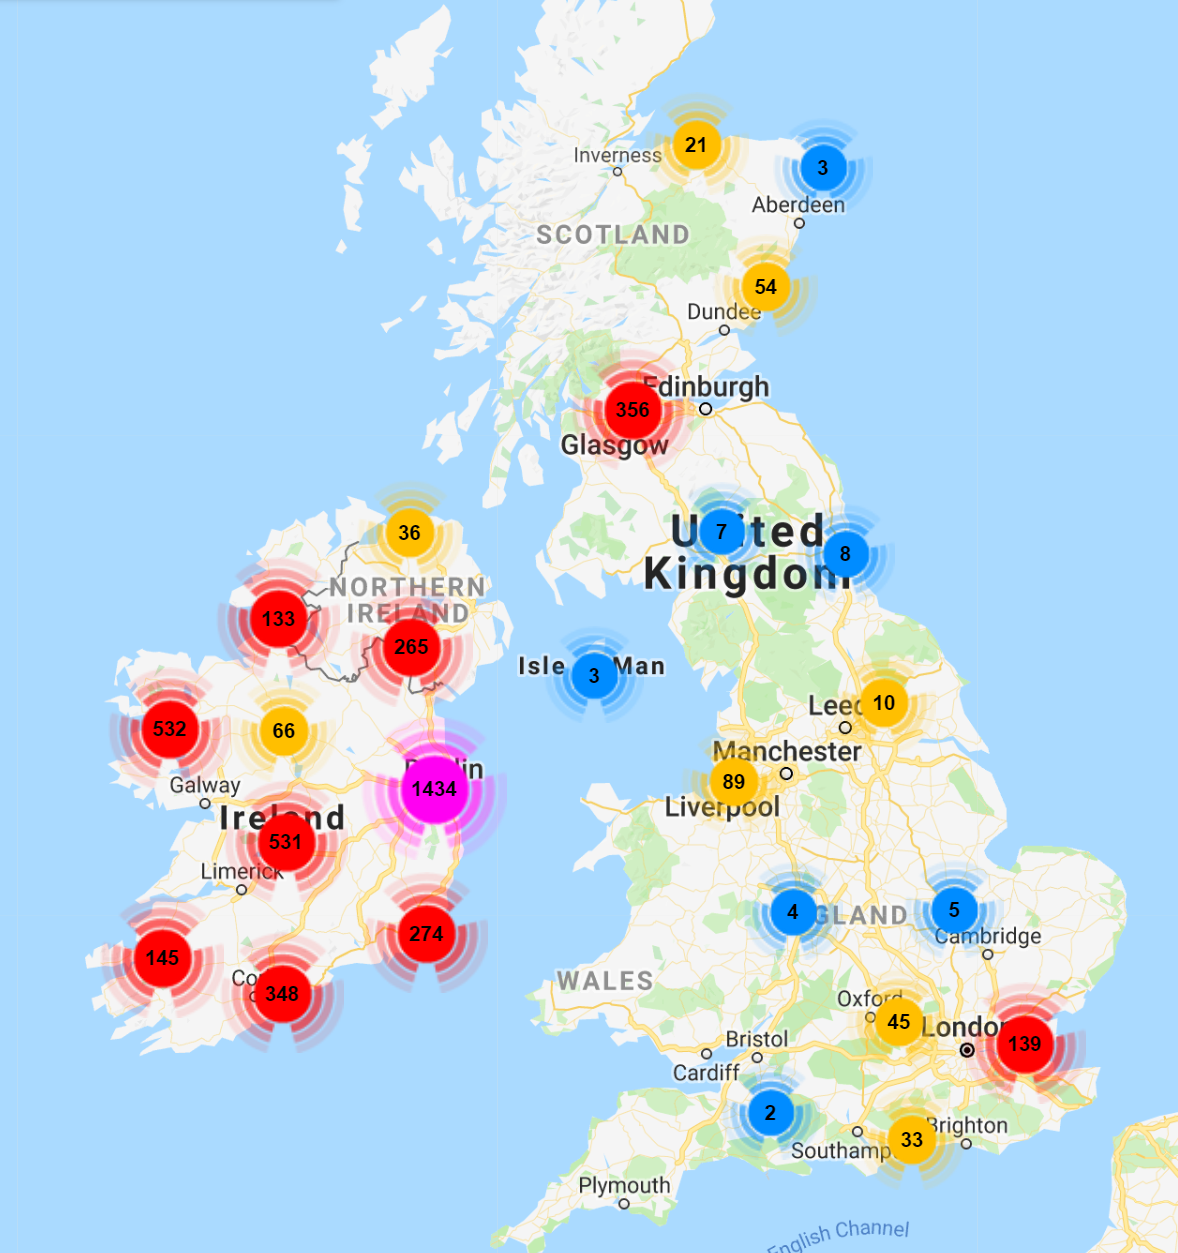
It is possible for us to employ a range of different technologies to capture origin and destination data. Idaso provides both Bluetooth Data Collection or Automated Registration Plate Recognition (ANPR) surveys depending on the project requirements.

PEDESTRIAN / FOOTFALL STUDIES
Whether for retail, event or infrastructure planning, footfall data can be invaluable, Idaso collects data on volumetric flows, demographics, behavioural data of pedestrians in both interior and exterior environments.
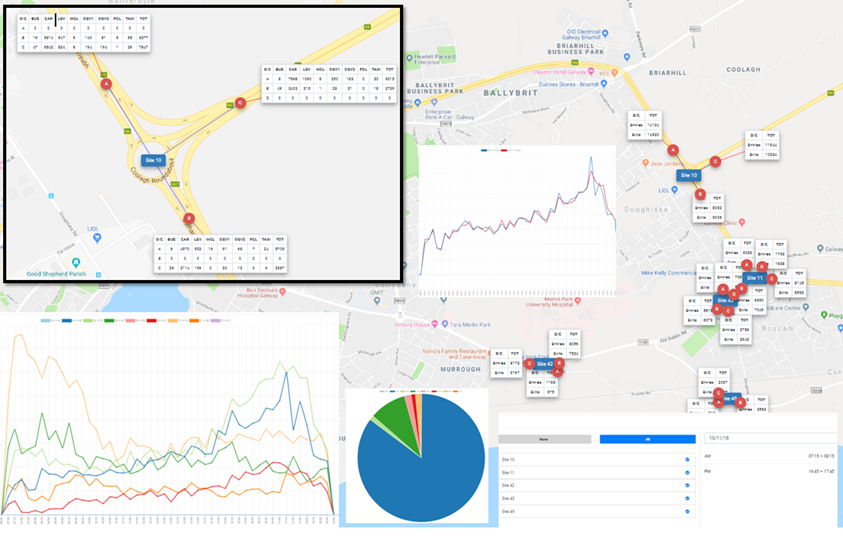
analyser
traffic data Analysis solution
Analyser enables the validation of your data accuracy and provides the tools for extracting the reporting building blocks for strategic planning, traffic impact assessments, property management and a vast number of other applications.
Smarter Counting contains a host of features to help smooth the process of data collection and processing for all stakeholders. Some of the basic features have been outlined below:
ACCESS TO SURVEY VIDEO FILES
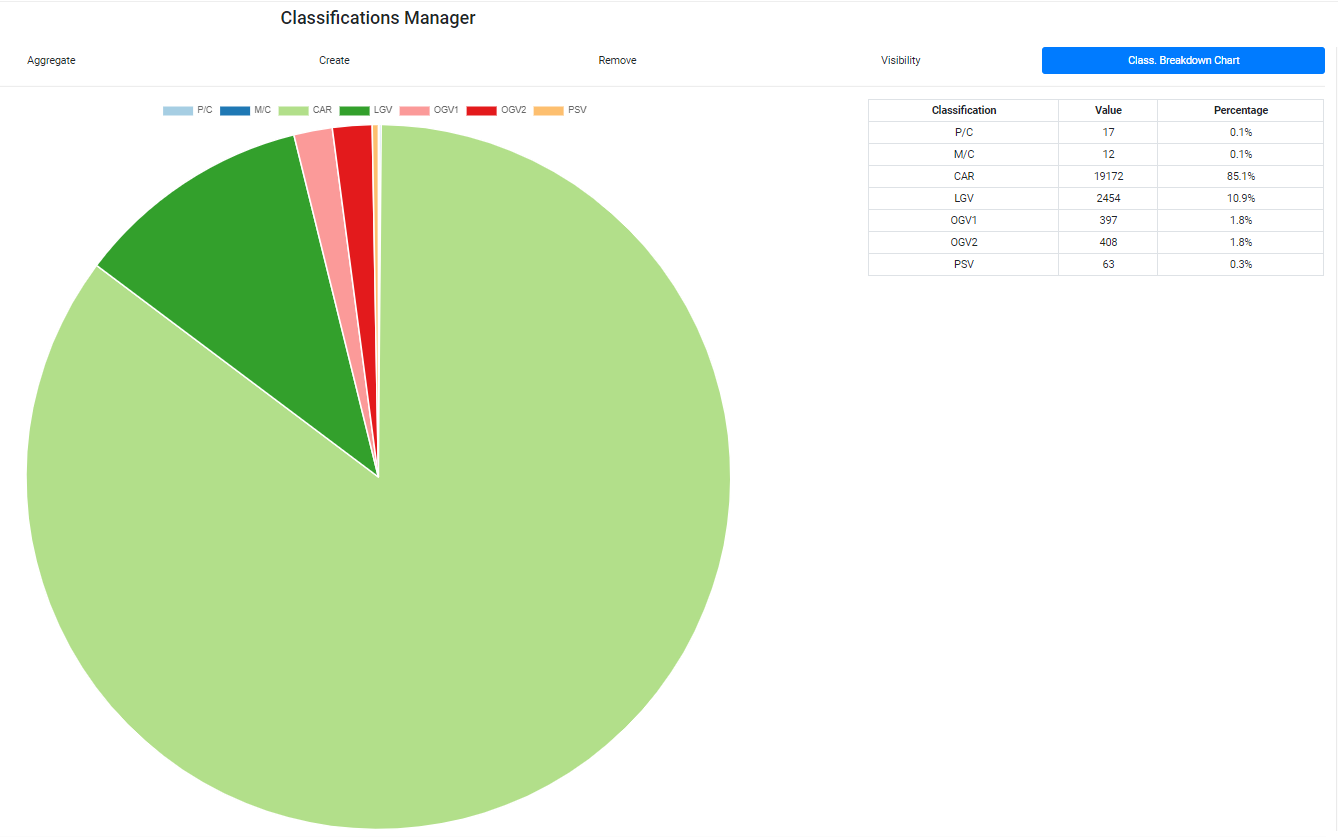
DATA VISUALISATIONS
CALCULATE PEAK HOURS
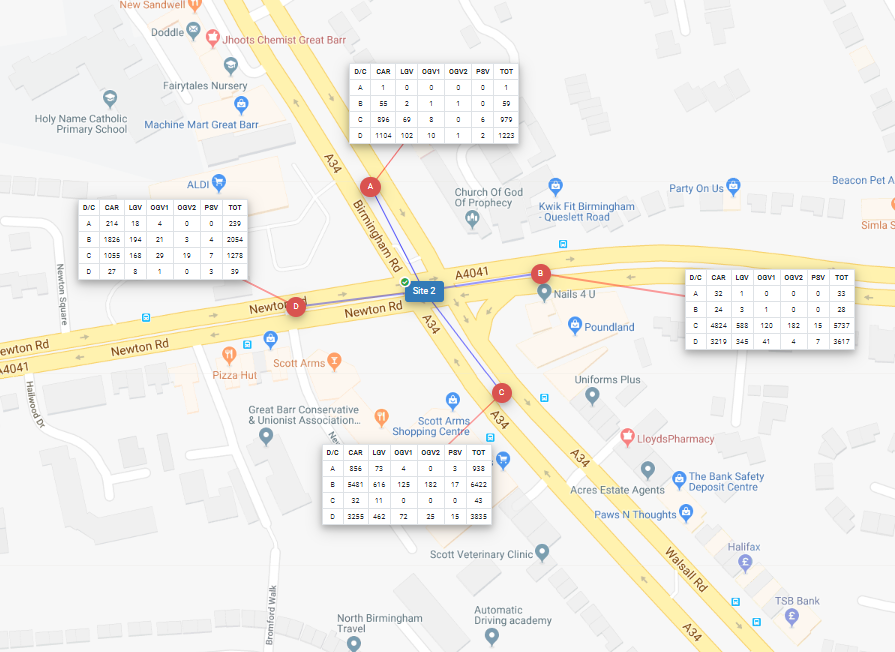
DISPLAY DATA IN TABLES ON THE MAP
FILTER DATA BASED ON TIME
APPLY GROWTH FACTORS
CHART DATA BETWEEN SITES
% BASED O/D MATRIX
DISTRIBUTION CHARTS
COMPARE FLOWS OVERTIME