Comment

Galway City Launches Mobility Dashboard supported by Idaso

Galway City Council Press Release 25.05.2021

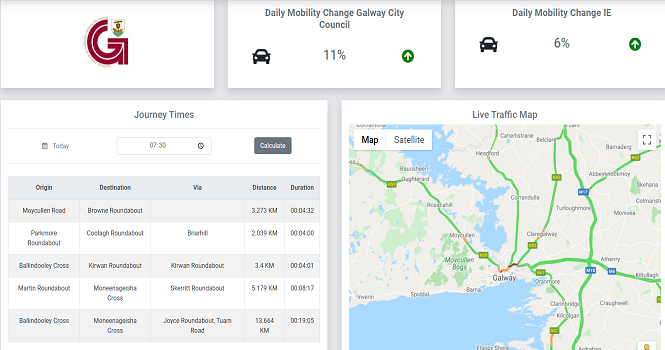
The Galway City ‘Mobility Dashboard’ is an online resource showing trends in travel patterns in Galway City, including real-time journey times; the number of cars moving through the city on a given day, and travel alerts. Comparison of traffic movements on the N6 Bothar na dTreabh shows daily traffic movements are increasing to pre-Covid levels as society reopens, with daily totals approaching 23,000 vehicles. This compares to daily totals of just over 11,000 vehicles for the same period last year when strict Covid restrictions were in place, and up to 25,000 vehicles per day pre- Covid. The Galway City Mobility dashboard has a number of tools and tabs to visualise information about travel in Galway City, and will be of interest to both the public, and Consultants delivering transport, housing or other capital projects in the City. The Dashboard can be accessed through https://mytrafficcounts.com/public-login

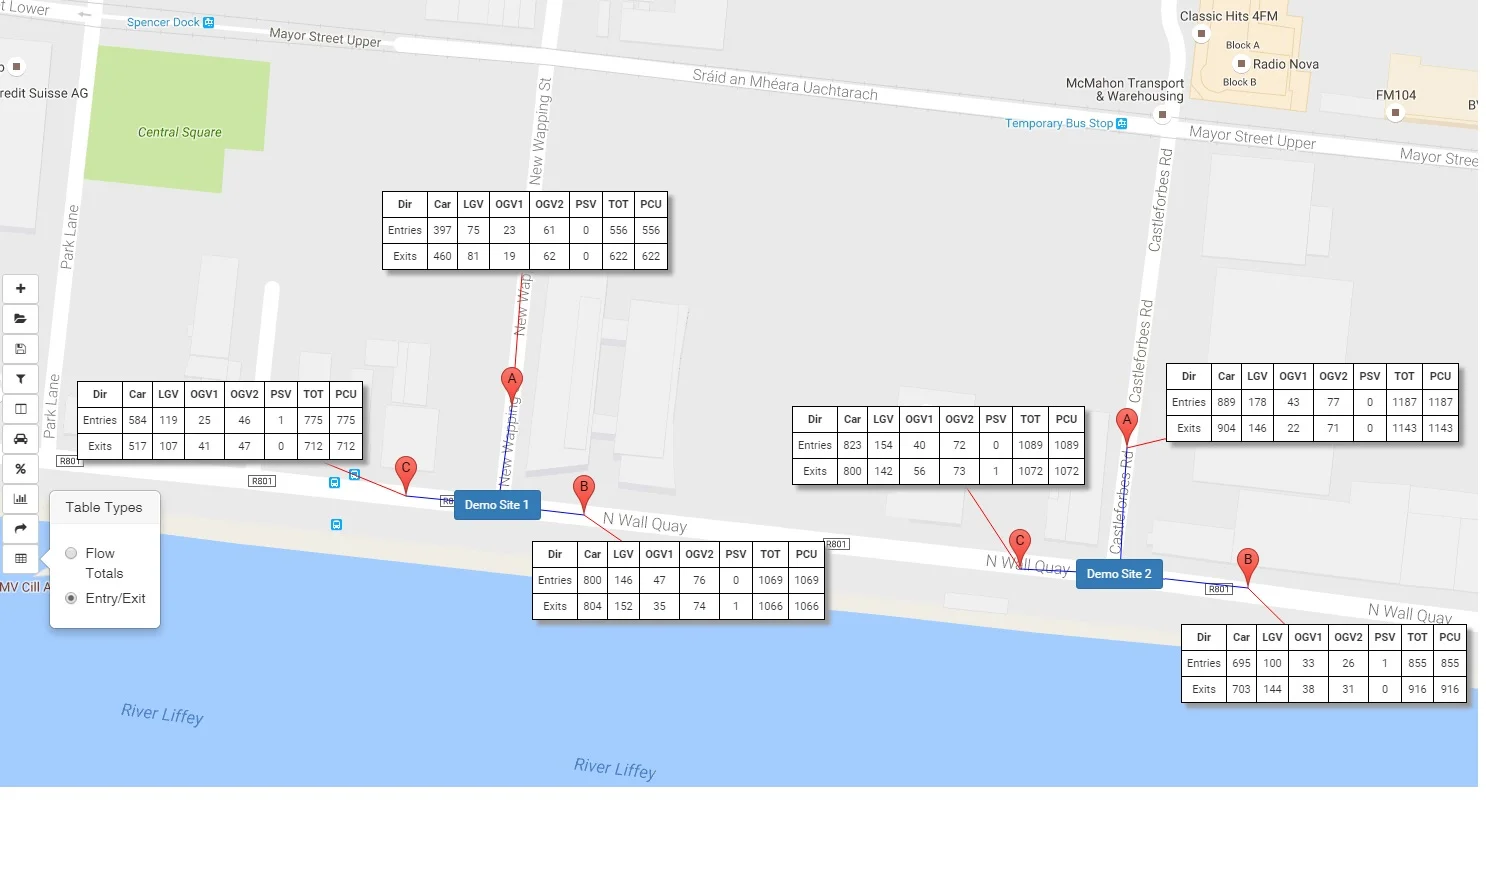
Commenting on the dashboard, Susan Loughnane, Senior Executive Engineer with Galway City Council, said, “The Galway City Mobility Dashboard shows data from a number of sources including the annual Galway City traffic surveys; Census commuting data; travel time data; and permanent traffic counters. Data from a number of traffic sensors across the city will be added in the coming months. The dashboard is currently at a ‘beta’ stage, meaning that it is undergoing testing as new data sources and tools are added. Feedback on the dashboard is welcome through roads@galwaycity.ie”

The Galway City Mobility dashboard is funded through the National Transport Authority Stimulus grants 2020 and was developed by Idaso Ltd. Please note the site is best viewed in the latest version of Chrome.

Comment

Comment

Traffic Volumes in Ireland during the Covid 19 Restrictions

Covid 19 has had a fundamental impact on all our lives over the past few months. Of course when the reasons to be out and about are removed, when we are encouraged to work from home, limit our social interactions and close the places we typically go to, then it follows that traffic volumes will plummet, and plummet they did. However it is worth observing how quickly the volumes recover, what modes bounce back, and what if any will be the lasting effects on travel behaviours.

IDASO has been actively involved in monitoring volumes over this period, below is an info-graphic of a junction in North Dublin surveyed in January 2020 and then again during each phase of the restrictions. Whilst this is just one junction, it does give a good indicator of commuter traffic in Dublin and how quickly volumes have increased. The latest survey was conducted at the end of Phase 2, the schools remain closed albeit now for the summer holidays so we would expect volumes to be down anyway. The am peak is still well below normal flows, where as the differences for the rest of the day are less pronounced. It will be interesting to see the results of the next survey schedule to happen at the end of this phase.

Covid Junction analysis.jpeg

Comment

Comment

Mobility Data Dashboard

Times have been a more than a little strange for many of us, some sick, some have lost loved ones, others are coping with the additional strains that the pandemic and the consequential restrictions created. Our team wanted to do something to help in these difficult times. Data collection and presentation is what we do, so it seemed obvious that we should start pulling together different data sources in one location so as to help decision makers and stakeholders see how the restrictions are effecting travel patterns.

https://mytrafficcounts.com/mobility

mobility data dashboard - Map View.PNG.jpg

Comment

Comment

Historic Traffic Counts Database

Due to the current restrictions as a result of the COVID 19 pandemic, traffic patterns are obviously far from normal. This has meant that it is not possible to gather baseline traffic flows for planning projects at the moment. In response to this IDASO has launched the website mytrafficcounts.com a database of traffic surveys collected over the past 4 years.

My Traffic Counts Promotion Post.jpg

Comment

Indian Ambassador to Ireland Sandeep Kumar visits IDASO Head Office

It was an honour to welcome the Indian Ambassador to Ireland Sandeep Kumar to the IDASO Head Office in Mullingar on Friday. A very charming man passionate about creating business links between our countries. It was a pleasure to be able to introduce the technologies IDASO has been working on and how they are being applied in the cities around the world as well as being able to promote the benefits of the Midlands of Ireland as an ideal location for fostering the growth of tech companies looking for a European base.

Sandeep+Kumar+-+Ian+Kerr.jpg

Launch of Global Team Plus

Comment

Launch of Global Team Plus

After the successful launch of Global Team and Idaso has now further developed the application to cater to the needs of consulting engineers. We spoke to over twenty engineers on the topic of traffic data collection and the pain points they experience. This feedback has formed the roadmap for Global Team Plus (GTP) which is now in beta testing with a closed group of customers. Gobal Team Plus Video

A great example of how user feedback has helped unform the development of GTP is.........

Comment

Comment

Global Team Beta

We are delighted to announce that our latest software solution has entered Beta testing. Global Team is a crowdsourced labour force provider that enables traffic data collection professionals access hundredths of enumerators around the world who have been trained in using Idaso's "Smarter Counting eNumerate" software. This product offers a host of additional features such as cloud storage of data and video files as well as dynamic vehicle flow maps.

Comment